
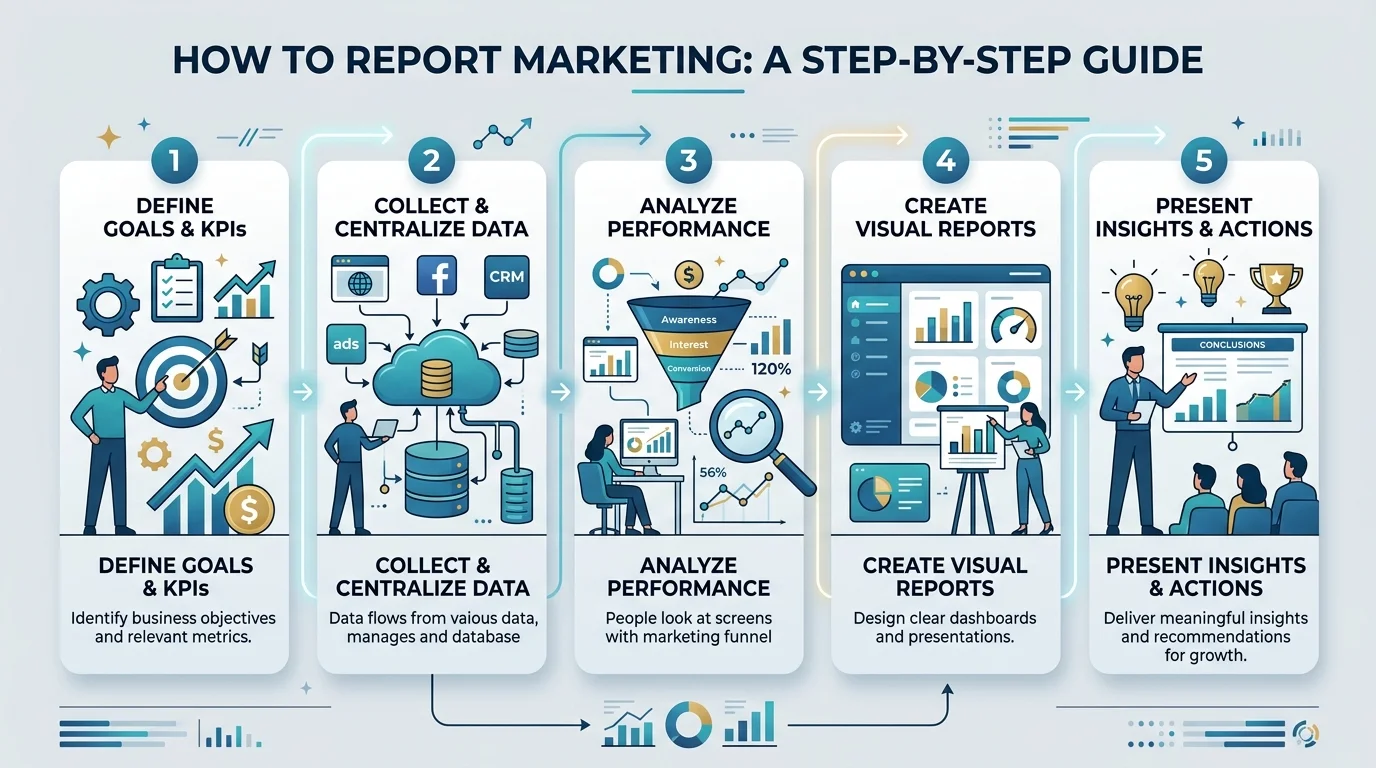
Report Marketing means collecting your campaign data — clicks, leads, spend, conversions — and turning it into a clear story that shows what happened, why it happened, and what to do next. In 2026, the best marketing reports lead with a summary, use a handful of focused KPIs, are automated wherever possible, and are tailored to whoever's reading them.
Now let's get into exactly how to do it.
I'll be honest with you — the first time I had to put together a marketing report, I panicked.
I opened a blank spreadsheet. I stared at it. Then I closed my laptop and made a coffee instead.
Sound familiar?
Here's the thing, though. Once you understand the system behind good marketing reporting, it stops being scary. It actually becomes kind of fun. You get to watch numbers turn into a story — and that story is what gets you budget, buy-in, and respect from your boss.
So let's break this down together, step by step, the way I wish someone had explained it to me.
What Is Marketing Reporting, Really?
Okay, quick definition before we dive in.
Marketing reporting is the process of collecting campaign data — clicks, leads, spend, conversions — and turning it into insights a stakeholder can actually understand and act on.
Notice I said act on. Not just look at.
Because here's a mistake I made for years: I used to build reports that were basically just screenshots of dashboards. Pretty, sure. Useless? Also yes.
According to NetSuite's guide on marketing reporting, the best reports always lead with an overview — the "so what" — before diving into the weeds. Your reader shouldn't have to hunt for the point. Give it to them immediately.
If you're still figuring out your broader marketing strategy, it might help to first check out our guide on how to start digital marketing — it'll give you the foundation that makes reporting way easier down the line.
Step 1: Get Your Data House in Order
You can't report on messy data. Trust me, I've tried.
Data accuracy is the boring-but-critical foundation of everything else you'll do. If your numbers are wrong, your whole story falls apart — and worse, you lose credibility with stakeholders.
1.1 Audit Your Data Sources Regularly
Don't assume your Google Analytics setup is still tracking correctly six months later. Tracking breaks silently all the time — check it monthly, not yearly.
1.2 Centralize Everything
Pull data from your CRM, ad platforms, email tool, and website analytics into one place. According to Funnel's reporting guide, building automated data pipelines that don't break with API updates is a total game-changer heading into 2026, when most teams now pull from 5+ platforms at once.
1.3 Standardize Your Definitions
What counts as a "qualified lead" on your team? Get everyone agreeing on the same terms before the report goes out.
Small step. Massive payoff.
Step 2: Know Who You're Actually Talking To
This one changed everything for me.
You're not writing the same report for your CMO that you'd write for a media buyer. Obviously, right? But so many marketers still send one giant report to everyone and hope for the best.
Don't do that.
Your executive summary needs to hit different notes depending on the audience:
Leadership wants high-level business impact — revenue, pipeline, big trends.
Operational teams (think performance marketers or paid social managers) want granular, near real-time detail.
The folks over at DiggGrowth put it well: tailor your reporting cadence to each role's sphere of control. Give operational roles daily or weekly dashboards. Give strategic roles monthly or quarterly rollups.
Otherwise? People tune out. Fast. In fact, one industry survey found that 46% of marketing leaders lack timely data to make strategic decisions — a huge chunk of that comes down to reports that just aren't built for the right audience.
Step 3: Pick the Right Marketing KPIs (Not All of Them!)
Here's a trap I fell into early on — trying to report everything.
Big mistake.
You don't need forty metrics. You need the five or six that actually move the needle for your specific goals.
3.1 Common Marketing KPIs Worth Tracking
Cost per lead (CPL)
Customer acquisition cost (CAC)
Return on ad spend (ROAS)
Conversion rate
Click-through rate (CTR)
Marketing qualified leads (MQLs)
3.2 Match KPIs to Goals
If your goal is brand awareness, don't obsess over CPL. If your goal is pipeline generation, don't get distracted by vanity social metrics like follower counts.
Marketing Goal | Primary KPI to Track | Secondary KPI |
|---|---|---|
Brand awareness | Impressions/Reach | Engagement rate |
Lead generation | Cost per lead (CPL) | MQLs |
Sales/Revenue | ROAS | Customer acquisition cost |
Retention | Repeat conversion rate | Email open rate |
Match the metric to the mission. Every time.
Step 4: Choose the Right Report Type
Not every report needs to look the same. In fact, it shouldn't.
Here's a quick breakdown, based on research from Whatagraph and Improvado:
Report Type | Best For | Frequency |
|---|---|---|
Strategic dashboard | Executive reviews | Weekly/Monthly |
Operational dashboard | Daily optimization | Daily |
Analytical dashboard | Deep dives | Ad-hoc |
Tactical report | Single campaign tracking | Per campaign |
Most teams only need two or three of these — not one giant mega-dashboard trying to do everything. Building too much just creates maintenance headaches down the line.
Popular Reporting Tools Compared (2026)
Tool | Best For | Notable Feature |
|---|---|---|
Looker Studio | Free, flexible dashboards | Deep Google Ads/Analytics integration |
Databox | Small teams, quick setup | Pre-built templates |
AgencyAnalytics | Agencies with multiple clients | White-label client dashboards |
Improvado | Enterprise, 1,000+ data sources | Automated data pipelines |
Curious which AI-powered platforms can help automate this whole process? We've rounded up the best options in our guide to top AI tools for marketing.
Step 5: Tell a Story, Not Just Stats
This is where most reports die a slow, boring death.
You dump numbers on a slide. Nobody reacts. Meeting ends. Nothing changes.
Instead — and I mean this sincerely — treat your report like a mini-narrative. What happened? Why did it happen? What are you doing next?
As Databox puts it so simply: report what happened, what changed, then talk about what to do next.
That's literally the formula. Steal it.
Be Honest, Even When It's Ugly
I know it's tempting to bury the bad numbers. Don't.
According to DashThis's roundup of expert advice, disclosing everything — including the disappointing stuff — is what actually builds long-term trust with your clients or leadership. It shows you're paying attention and already planning the fix.
Honesty isn't just the right move ethically. It's the smart strategic move too.
Step 6: Automate What You Can
Look, you don't have time to manually copy-paste numbers into a spreadsheet every single week. Nobody does.
This is where marketing dashboard tools become genuinely worth the investment. Platforms that pull live data from your ad accounts, CRM, and analytics tools save you hours — and they reduce the risk of human error creeping into your marketing analytics.
If you're still building reports by hand, I'd genuinely encourage you to explore an automated reporting tool. The upfront learning curve is small compared to the time (and sanity) you'll get back every single week.
Frequently Asked Questions
How often should I report on marketing performance?
It depends on the role. Operational teams (paid media, social) benefit from daily or weekly reports. Leadership typically only needs monthly or quarterly summaries.
What's the difference between a marketing metric and a KPI?
A metric is any raw number — like website visits or email opens. A KPI is a metric tied directly to a business goal, like cost per lead tied to your budget efficiency target.
What should be in an executive marketing report?
Focus on high-level outcomes: revenue impact, pipeline growth, ROAS, and 2–3 key takeaways — skip granular channel-level detail.
What tools are best for marketing reporting in 2026?
Popular options include Looker Studio (free, flexible), Databox (quick setup), AgencyAnalytics (agency-focused), and Improvado (enterprise-scale data integration).
How do I make my marketing report more persuasive?
Lead with an overview, be honest about underperformance, and always end each section with a clear "what's next" recommendation rather than just raw numbers.
Final Thoughts: Reporting Is a Skill, Not a Chore
Here's what I want you to take away from all this.
Marketing reporting isn't just busywork you do to keep your boss happy. Done right, it's your best tool for proving your value, sharpening your strategy, and making smarter decisions going forward.
Start small. Fix your data. Know your audience. Pick a handful of KPIs that matter. Automate what you can. Tell the story behind the numbers.
You've got this.
Found this helpful? Share it with others who might benefit from these insights!
Submit Your AI Tool